
Dashboard Analytics Overview
Find analytics in the Dashboard tabs and approved weekly reports in Business Files.
Who is this article for?
Open Dashboard to review your organisation’s performance. Analytics now sit in dashboard tabs; an old Analytics bookmark takes you back to Dashboard.
Choose the right dashboard tab
Check the organisation switcher before reviewing figures.
Choose a tab for the part of the business you want to review.
Set the location and date filters available in that tab. Use the same filters when comparing figures.
| Tab | What to review | | ------------------- | ---------------------------------------------------------------- | | Overview | A starting summary and shortcuts into other dashboard sections. | | POS Data | Analytics from connected point-of-sale integrations. | | Sales Orders | Sales, cost of goods sold, gross profit and product performance. | | Inventory | Stock levels, stock value and inventory health. | | Stock Take | Latest closed periods and current open periods. | | Purchase Orders | Purchasing activity and supplier spend. | | Operations | Demand patterns and profitability by weekday and hour (UTC). |
The Operations daypart view excludes labour and tracks service charges separately from margin. Its time buckets use UTC; check that basis when comparing it with a local-time report.
Compare sales items
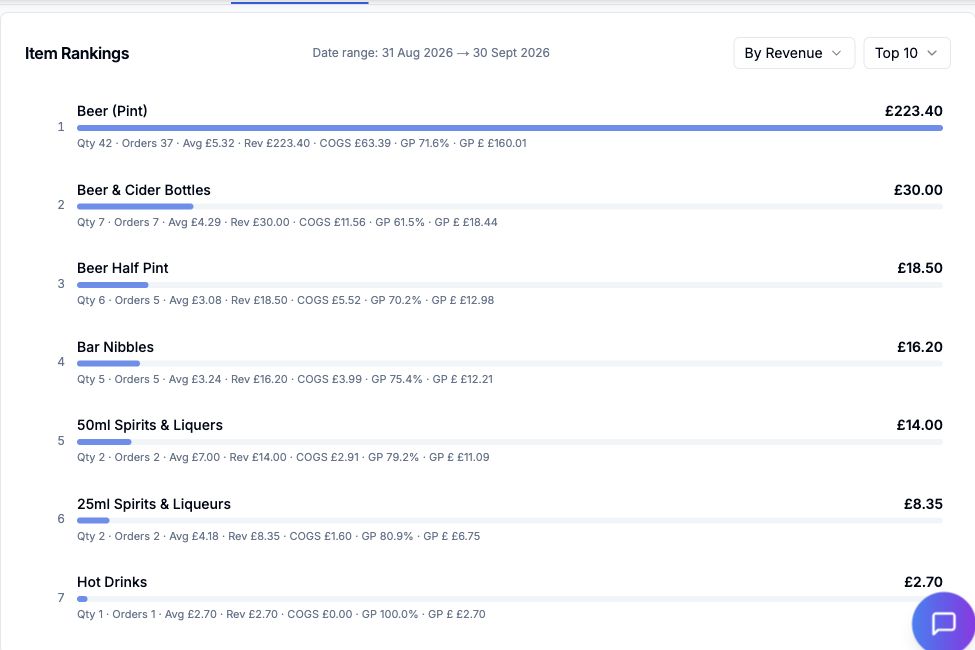
In Sales Orders, open Item Rankings and choose By Revenue, By GP %, By COGS or By Quantity. Check the date range and location before comparing items. The ranking controls let you review the top, bottom or all items.
 View larger
A high GP% depends on the costs recorded for that item. Check those costs before treating the ranking as evidence of profitability.
Understand plan access
Available data depends on your organisation’s plan and access. A tab marked Full plan opens an upgrade prompt when its feature is not included.
OPS includes inventory, stock takes, purchase orders and approved Profit Control reports. Raw sales, interactive POS data and broader operational analytics require Full Crunch. The OPS Overview focuses on the operational features included in that plan.
Find your weekly report
Open Business Files for approved Weekly Profit Control reports. Choose Open interactive report on the report for the week you want. These reports have their own coverage and review guidance; they are separate from the live dashboard tabs.
Read your Weekly Profit Control report
Export and download reports
Review sales-order profitability
Review stock-take analytics