
Review Sales Order Profitability in Lists and Analytics
Compare order profitability and use current Sales Orders analytics to review costs, margins, item rankings and revenue-source scope.
Who is this article for?
Compare orders in Sales Orders, then use Analytics for revenue, cost and margin trends. Open an order when you need to trace a surprising figure to its lines, modifiers and stock usage.
Compare Orders in the List
The list shows Total Sales, COGS and GP % for each order. Set the location, date range and Source before comparing orders from different channels.
Open an order to review line prices, applied modifiers, line-item COGS and the Inventory Impact.
Review Analytics
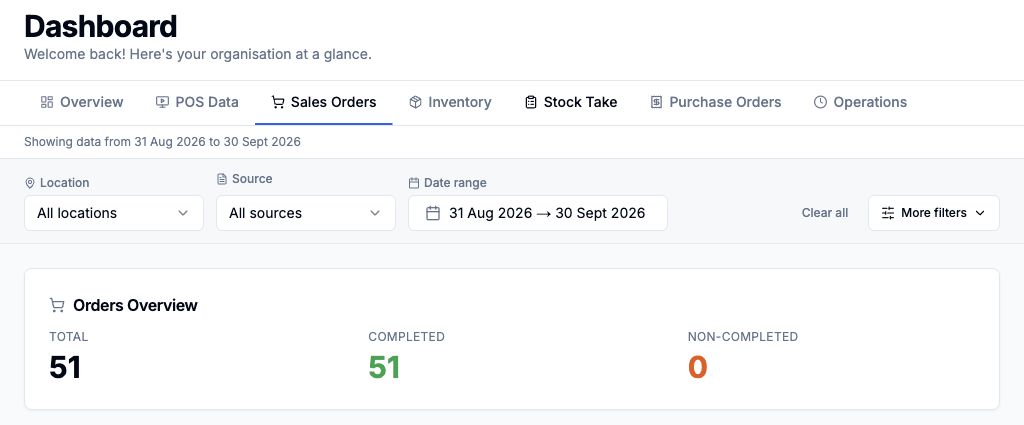
From Sales Orders, choose Analytics to open the dashboard's Sales Orders tab. You can also open that tab directly from Dashboard. Set the date range, location and Source before reviewing the figures.
 View larger
The current view includes:
- Revenue & Profit: Total Sales, Gross Profit, GP Margin and Net Revenue
- Costs & Averages: Total COGS, average order value and average COGS per order
- sales trends with Revenue, COGS, Orders and GP % metrics
- Profitability Snapshot
- item rankings by revenue, GP %, COGS or quantity
- a Product Profitability tab for item-level review
Net Revenue here is revenue after recorded tax, not profit. Gross Profit subtracts recorded product costs from eligible sales; it does not deduct wages, rent, utilities or other overheads.
Select a ranked item to inspect its sales, costs, modifiers and related orders. Check each section's date and location scope before comparing it with another report.
Keep Revenue Sources in Context
When Xero invoice revenue is included, analytics can show Till and Xero invoices separately. The screen explicitly labels GP and COGS as till only; Xero invoices contribute revenue, not margin.
A revenue-only order is not evidence of a 100% margin. Use Source and the report's scope labels when interpreting costs and GP.
Investigate an Unexpected Margin
- Match the location, date range and source.
- Find the item or order with unexpected COGS or GP %.
- Open the order and inspect the linked variation, modifiers and inventory consumption.
- Check recipe quantities and stock costs on the catalog item before changing its selling price.